5.7 Phase stability
Let us dwell on some problems pertaining to phase stability.
Consider the dependence of the chemical potential of a substance on the pressure
of each of the two phases at constant temperature. A dependence of this kind is
shown graphically in Fig. 5.6. Since
![]()
in Fig.
5.6 the curve 1 pertains to the phase with a greater density (smaller v), and curve 2 to the phase with
a smaller density. It will also be noted that in the φ and p coordinates
the convexities of the isotherms are always facing upward, since, as it is
clear from Eq. (5.99),
 (5.127)
and the
quantity (dv/dp)T,
according to Eq. (5.64), is always negative.
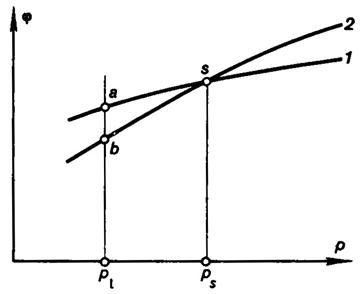
Fig. 5.6
Assume that curve 1 pertains to the liquid phase (φl),
and curve 2 to the saturated-vapor phase (φv). It is
clear that point s, at which the
curves 1 and 2 intersect, i.e.
at which φ1 = φ2, is the point of phase
equilibrium for the given substance (the pressure is ps).
In accordance with the additivity rule, the expression for the isobaric-isothermal
potential of a two-phase system can evidently be written as
![]() (5.128)
(5.128)
Consider a system, comprising two phases at the same pressure and temperature[1]
(points a and b on the isobar p1 Fig. 5.6). If this
state is not a state of equilibrium for the system considered, hence this
isobaric-isothermal system is capable of undergoing a process leading to a
change in the system potential Φ. Since the pressure and temperature are
constant, it is clear that φl and φv remain
constant during this process, so that dφl = 0 and d φv
= 0. It follows that the quantity Φsys can change only at the
expense of Gl
and Gv, and from Eq.
(5.127) we obtain:
![]() (5.129)
(5.129)
At the same time it is known that
![]() (5.130)
(5.130)
and, consequently,
![]() (5.131)
(5.131)
Equation (5.129) acquires then the following form:
![]() (5.132)
(5.132)
Since in the process of coming into equilibrium the potential Φ of
an isobaric-isothermal system always diminishes, tending to a minimum (see Sec.
5.2), i.e. dΦsys < 0, the sign of the differential dGv is determined by the
sign of the difference (φv - φl).
From Fig. 5.6 it is clear that to the left of point s, i.e. at p < ps
we have • φv < φl and, consequently, dGv must be greater than
zero. This means that in this system there will be mass transfer from the
liquid phase to the vapor phase. To the right of point s, i.e. at p > ps,
φv < φl and, consequently, dGv < 0; there is mass
transfer then from the vapor phase into the liquid phase. Thus,
if φv > φl, then dGv < 0 and,
consequently, the stable state of the system is the liquid state;
if φv < φl, then dGv > 0 and,
consequently, the stable state of the system is the vapor phase.
The foregoing permits the unambiguous conclusion that with given p and
T, the more stable of
the two phases is the phase whose chemical potential is smaller.