7.1 The isochoric process
Let us consider the basic thermodynamic processes, look into their
regularities and set up the equations relating the parameters of state of
substance in these processes.
The isochors of a real gas are plotted on the p-T diagram shown in Fig. 7.1,
which also shows the isochors on the p-v, T-v and T-s diagrams. Consider an isochoric process realized from
state 1, in which the
working medium is under a pressure p1 temperature T1 and has a volume V, to state 2. To determine the parameters, or properties,
of state 2, it is
sufficient to know one of the parameters at point 2 (for instance,
pressure p2 or temperature T2). Inasmuch as the state of the substance undergoing the
process changes along an isochor, one more parameter of state is given, and
that is volume V. Knowing V and T2 (or V and p2
or V and s2, etc.),
all other parameters characterizing the state of the working medium at point 2
can be determined with the aid of the diagram of state, the equation of
state or tables of thermodynamic properties of the given substance.
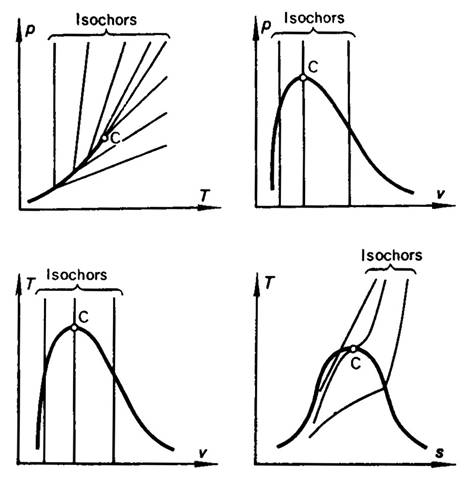
Fig 7.1
The parameters of state of an ideal gas on the isochor are related by
equation (1.16)
![]()
An increase in the temperature of an ideal gas kept in a vessel of
constant volume always results in an increase in pressure, with the pressure
rising at a rate which is greater the smaller the value of v on the
given isochor (this follows from the hyperbolic nature of the isotherms of an
ideal gas on the p-v diagram).
Heating of real gases and liquids also results in an increase in
pressure, with the pressure of the liquid rising at a rate considerably greater
than the rate of increase in gas pressure (the p-T diagram in Fig. 7.1).
It is of interest to note the curious property inherent in isochors of
water at low temperatures. As was already mentioned above, at a temperature of 3.98 °C the maximum density of water is at atmospheric
pressure. A detailed investigation shows that in this temperature interval the
isochors plotted for water have the form illustrated in Fig. 7.2; the isochors
for v ≤ 1.000000 ml/g pass
through a minimum near the point at which the temperature is 3.98°C (denote
this point of minimum by A), with
the isochor for v = 1.000000 ml/g touching the saturation line. The
slope of the isochors to the left of the minimum points is negative, i.e. (dp/dT)v <
0. Isochors plotted for water for v > 1.000000 ml/g (up to v =
1.000132 ml/g, corresponding to the triple point) are characterized by the fact
that they cross the saturation line twice, with a positive and a negative
slope. Thus, when water undergoes an isochoric process at T < TA, heating of the system will lead to
a drop in system pressure. With rising temperature, the system corresponding to
isochors for 1.000000 < v <
1.000132 ml/g will pass from a single-phase state into a two-phase state, and
then again into a single-phase state.
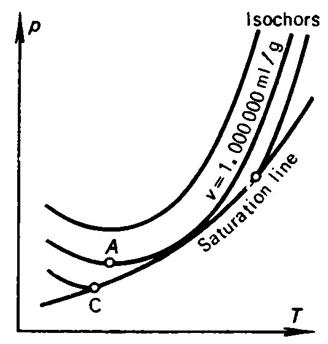
Fig. 7.2
We shall note some characteristic properties of an isochoric process
realized in a two-phase medium. Consider heating a vessel of constant volume V, containing a liquid (water, for
instance) in equilibrium with its saturated vapor. Denote by G the mass
of water and its vapor confined in the vessel. The
specific volume v of the two-phase mixture filling the vessel will then
be V/G. Consider
two cases: first, an amount of water is poured into the vessel such that the
specific volume of the two-phase mixture v1 is smaller than the critical volume vcr, and second, v2 > vcr
(Fig. 7.3). Let us determine how the state of the steam-and-water
mixture in each of these vessels will change with isochoric heating from the
same temperature T. The investigation can be facilitated by plotting the
state of the mixture in each of the vessels on a T-v diagram, in which
point 1 corresponds to the state of the steam-and-water mixture in the
first vessel prior to heating (specific volume v1, temperature T), and point 2 to the state of the mixture in the second
vessel before heating (v2
and T). The
dryness fraction of the mixture in each vessel, x, is determined from
the relationship
![]()
where v"
and v' are the specific volumes of dry saturated steam and water,
respectively, on the saturation line at a temperature T, and vt.ph. is the specific
volume of the two-phase mixture in a vessel (in this example, v1 or v2).
Isochoric heating will be accompanied by a change in the ratio between
the amounts of water and steam in the vessel, i.e. by a change in the dryness
fraction of the two-phase mixture. As can be seen from Fig. 7.3, at v1 = const first dx >
0, then dx < 0; at v > vcr, dx is
always greater than zero, dx > 0. Upon reaching a certain temperature
Ta, the entire vessel is filled with water, and with further
heating the isochor v1
= const passes into the liquid region (Ta is the
temperature at which the specific volume of water on the saturation line, v',
equals v1). Another picture is observed
when the temperature in the second vessel rises: on the isochor v2 = const, heating is accompanied by an increase in the dryness
fraction x of the mixture, water evaporates in the vessel and the level
of water decreases. When temperature Tb is reached (the
temperature at which v" equals v2),
the entire vessel is filled with dry saturated steam and further heating takes
place in the superheated steam region. Finally, if the vessel is filled with an
amount of liquid corresponding to the specific volume vcr and heated to the
critical temperature Tcr, the meniscus separating the liquid
and vapor disappears at approximately midheight of the vessel.
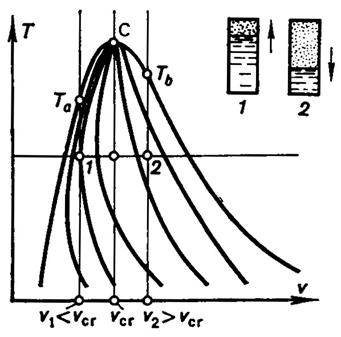
Fig. 7.3
The work done by a system undergoing isochoric expansion is equal to zero.
From the relationship
![]()
it is
clear that for an isochoric process, when v = const,
![]() (7.1)
(7.1)
The amount of heat added to a system undergoing isochoric heating is
determined from the mathematical statement of the first law of thermodynamics:
![]()
Since
for an isochoric process dv =
0,
![]()
and,
consequently, the amount of heat added to a system undergoing heating from
state 1 (the parameters of this state are v and T1) to state 2 (with
parameters v and T2) will be equal to the difference between the internal energies u2, and u1:
![]() (7.2)
(7.2)
The difference in the internal energies of the two states will be
determined on the isochor in the following way. From the obvious relationship
 (7.3)
(7.3)
taking
into account Eq. (2.31), we obtain:
 (7.4)
(7.4)
Thus, the relationship (7.2), expressing the amount of heat involved in
an isochoric process, can be presented in the following form:
 (7.5)
(7.5)
If we apply the concept of the average heat capacity ![]() , relationship (7.5) can be written in the
following form:
, relationship (7.5) can be written in the
following form:
![]() (7.6)
(7.6)
Finally, when heat capacity is constant in the temperature interval
considered, we have:
![]() (7.7)
(7.7)
The change in entropy in an isochoric process is determined in the
following way. From the relationship
 (7.8)
(7.8)
taking
into account Eq. (4.47), we get:
 (7.9)
(7.9)
With data on the heat capacity cv
available, this equation can be easily used to calculate the change in entropy
in an isochoric process.
If heat capacity is constant within the temperature interval considered,
and, consequently, cv can be taken out of the integral, we
obtain from Eq. (7.9):
![]() (7.10)
(7.10)
i.e.
the dependence of entropy on temperature on the isochor is logarithmic.