7.2 The isobaric process
The isobars (constant-pressure lines) of a real gas are plotted on the T-v, T-s, p-v and p-T diagrams
shown in Fig. 7.4.
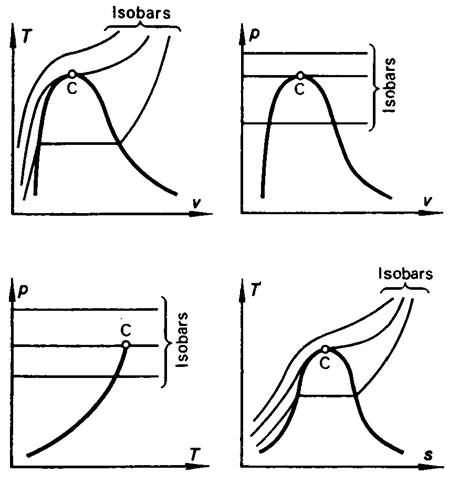
Fig. 7.4
If a system undergoes an isobaric process from state 1 to state 2, and if the properties (parameters)
of the system in state 1 are known, to determine system parameters in
state 2 it is sufficient to know one of the parameters of the system at
point 2 (the second parameter, pressure, is known). Other system parameters
of state at point 2 can be determined with the aid of the diagrams of
state, equation of state or from tables of thermodynamic properties of substances,
just as described above for the isochoric process.
The parameters of state of an ideal gas are related on the isobar by
equation (1.15):
![]()
It follows from the above that the higher the temperature of a gas, the
greater its specific volume (i.e. the smaller the density of the gas). On the
isobar, the quantity v increases with rising temperature at a rate which
is greater, the smaller the pressure (this can be ascertained by considering
the isotherms on the p-v diagram).
When heated, real gases, liquids and solids also undergo thermal expansion
on the isobar (with the exception of some anomaly regions of state, just as the
region of water anomaly at low temperatures mentioned in the preceding
section). We know that with an equal increase in temperature, a gas expands
considerably more than a liquid or a solid, verified by the behavior of the
isobars on the diagram of state shown in Fig. 7.4.
The work of expansion done by a system undergoing an isobaric process is
determined in the following way:
![]() (7.11)
(7.11)
For an ideal gas this relationship, taking equation (1.23) into account,
can also be presented in the following form:
![]() (7.12)
(7.12)
The quantity of heat added to a system undergoing isobaric heating (or
removed from the system, if cooled) is determined in the following manner. From
the mathematical statement of the first law of thermodynamics, expressed by Eq.
(2.44),
![]()
it
follows that for an isobaric process (dp
= 0)
![]()
and,
consequently, the quantity of heat added to a system undergoing heating from
state 1 (with parameters p and T1) to state 2 (with parameters p and T2) is equal to the difference between
the enthalpies in these states:
![]() (7.13)
(7.13)
The values of h1
and h2 which
are needed to calculate q21
can be taken from the tables of thermodynamic properties of a given
substance or from the diagram of state of this substance.
The difference between the enthalpies of the two states on the isobar
can also be expressed in the following way. From the obvious relationship
 (7.14)
taking
into account Eq. (2.46), we obtain:
 (7.15)
It follows from Eq. (7.15), expressing the amount of heat involved in an
isobaric process, that (7.13) can be written in the following form:
 (7.16)
or,
which is the same,
![]() (7.17)
(7.17)
where ![]() is the average
heat capacity cp in the (T1,
T2) temperature interval. If cp does not depend on
temperature,
is the average
heat capacity cp in the (T1,
T2) temperature interval. If cp does not depend on
temperature,
![]() (7.18)
(7.18)
The change in entropy in an isobaric process, i.e. the difference
between the entropies corresponding to states 1 and 2, is determined from the relationship
 (7.19)
or,
taking Eq. (4.45) into account,
 (7.20)
When heat capacity is independent of temperature in the temperature interval
considered and can, therefore, be taken out of the integral sign in Eq. (7.20),
we get:
![]() (7.21)
(7.21)
i.e. on
an isobar the dependence of entropy on temperature is logarithmic. The analogy
between this equation and Eq. (7.10), expressing the difference in entropies on
an isochor, will be easily understood; the only difference consists in the
factor preceding the term In T2/T1
- the isochoric (constant-volume) heat capacity cv in one case, and the isobaric (constant-pressure) heat
capacity cp in the other case.