If the reader will
correct translation and will send the improved text to the author
(ochkov@twt.mpei.ac.ru), the author will tell a thank.
 It is no trouble at all for us to build… a Bridge…
(Russian version of the article)
(Another articles of V.Ochkov)
V. Ochkov
(translation
into English I.Repkin, editing by Thomas
Porritt tporritt@tesoropetroleum.com)
The Mathcad 2000 environment presents about thirty new functions. The
most remarkable one is the odesolve function. It is unique for it does
not return a scalar, vector or matrix, as with the remaining «normal» built-in
Mathcad functions. Odesolve returns
a one-argument function that is a solution of the ordinary differential
equation (ODE).
The ODE
problem was being solved rather clumsily until the 2000 version of Mathcad. The
eleven built-in functions (Bulstoer, bulstoer, bvalfit, Rkadapt, rkadapt, rkfixed, sbval, Stiffb, stiffb, Stiffr and stiffr) had been returning not a solution
of the ordinary differential equation (i.e. a function reducing the initial
differential equation to identity), but a vector of values that satisfy the
identity equation. In order to define the solution function a user was forced
to resort to spline-interpolation. The odesolve function, on the other hand, is at
once «shampoo and conditioner[1]»:
it combines the numerical solution of the ODE (that is, the vector generation)
and the spine-interpolation providing a definition of the solution function.
The odesolve function has restored, in a manner of speaking, the beauty and naturalness of the solution process.
Formally,
the Mathcad 2000 environment allows similar solution of ordinary differential
equations and algebraic equations – the task conditions are "gripped"
between the keyword Given and the built-in function odesolve (or Find – speaking
of algebraic equations). The task conditions comprise the differential equation
itself and limitations reducing the task either to the Cauchy problem or to the
boundary problem.
Let's
illustrate the "beauty" of the odesolve function by the good-looking
graphical interpretation of its solution. In order to do this the «main» task
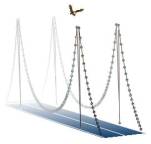
should be considered: extend a suspension bridge across (over) the river, with
the support cables fastened to a pylon at each edge of the bridges span. The
differenctial equation describing the sagging chain (the chain function) is
rather singular – the second derivative is equal to the function itself[2].
Figure 1 presents a solution of the given boundary problem using a
second-degree ODE.
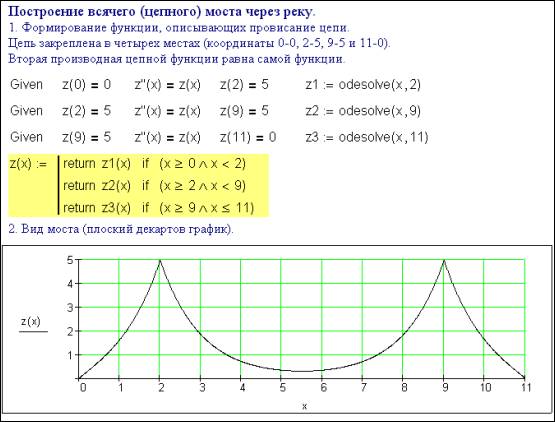
Figure 1
The result is the piecewise continuous function Z(x) allowing a carpet Cartesian diagram to be
plotted – that is the suspension bridge half face[3].
But the
bridge design is especially solid and should be depicted with volume
(three-dimensional) graphics. The Mathcad environment presents the
three-dimensional analog of the Cartesian diagram, namely a Scatter Plot – «the
strewing, dispersing graph». While the Cartesian diagram «operates» with two
vectors, «dispersing» their values[4]
on a plane, the Scatter Plot requires three vectors (we define them as X, Y and Z), dispersing the coordinate points over a certain volume[5].
The points
can be connected with lines following either the point number (from the zero
point to the first one, from the first point – to the second one and so on to
the last point) or the values of the X, Y or Z vector elements. In addition, the
points and the lines can be colored so that different hues[6]
depend either on the point number or on the values of the X, Y or Z vector elements.
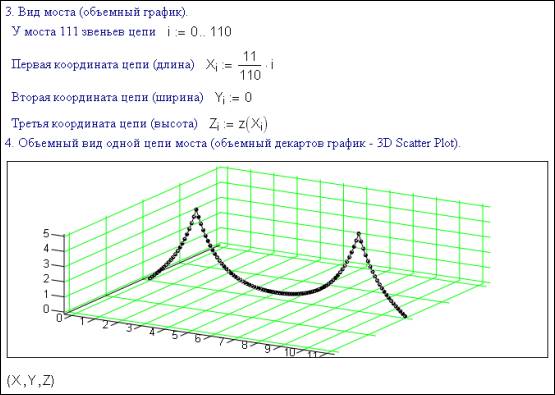
Figure 2
Figure 2 displays the bridge chain volumetrically from the
viewpoint of the spectator, though the chain is oriented in the plane (Yi := 0).
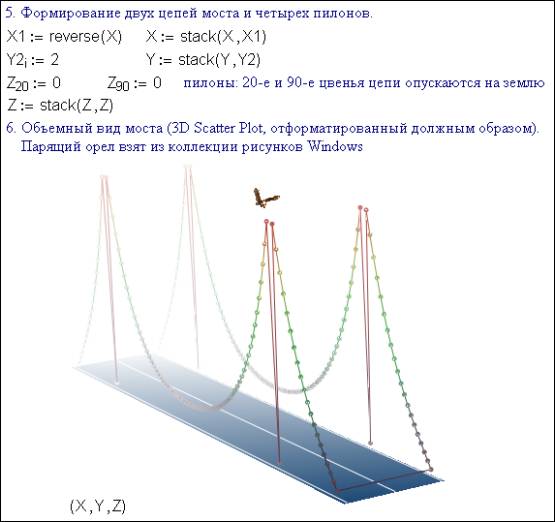
Figure 3
Figure 3 demonstrates the «half-turn» image of the
suspension bridge. To do this the following steps were taken:
·
The length
of the vectors Х, Y or Z was doubled: the chain (Х) stretches from the river bank and then it is reversed backwards
(reverse (X) [7]; the bridge width equals two (Yi := 0, Y1i := 2);
·
The
chain links resting on the pylons are grounded (Z20 := 0, Z90 := 0);
·
The
three-dimensional graph is formatted as follows: the axes and grids are
removed; the chain is colored along Z-axis; the X-Y plane is filled depicting
the roadway; three white grid lines are drawn on the Y-axis (that is the
roadway marking); perspective and mist are added to make the design look more
volumetric.
Comments to consider:
Construction
of a suspension (chain) bridge across (over) the river
1. Creation
of functions describing the chain sagging
The chain is
fastened to four points (coordinates 0-0, 2-5, 9-5 and 11-0).
The second
derivative of the chain function equals the function itself.
2. The
bridge appearance (plane Cartesian diagram).
3. The
bridge appearance (three-dimensional graphic).
The bridge
chain consists of 111 links
First
coordinate of the chain (length)
Second
coordinate of the chain (width)
Third
coordinate of the chain (height)
4.
Three-dimensional depiction of the single bridge chain (three-dimensional
Cartesian diagram – 3D Scatter Plot).
5. Creation
of the two bridge chains and the four pylons: the 20-th and 90-th links of the
chain are grounded
6. The
tree-dimensional bridge appearance (3D Scatter Plot properly formatted)
The soaring
eagle is presented by the Windows picture collection
At present
computers are widely used as painter’s tools (an intellectual brush or
something like that). Color printer listings are beautifully framed and
exhibited at real and virtual computer-art salons, so to say.
But the
author would like to draw attention of respected readers to another problem.
This is not simply the problem of computer pictures, but the program listing
problem and, in particular, the author would like the reader to pay his
attention to the problem of correspondence (or contraposition) of the listing
form within the program contents.
Astute
programmers noticed a long time ago that procedures and functions have thier
own «faces», allowing them to be recognized accurately when displayed or
printed out. Some procedures are like well-groomed peasant horses, they are
plump and sleek and just go on operating, for example, transferring data from
one format into another. They are outwardly unremarkable – they do not attract
rapt attention. Alternatively, other procedures always aim to spring a
surprise, for they are so riddled with bugs (green) that they resemble a
stallion saddled by the hero of numerous picturesque canvases and sculptures.
There are other procedures just crying out to be framed and hung upon a wall
for they are so beautiful and perfect. Thiershape entirely suits their
contents. They transmit not only the thoughts of their creator, painter, or
programmer, but also his mood and feelings.
This author
is far from being an art critic and does not dare to dilate much on the
subject.
Annotations
to published computer pictures emphasize, as a rule, the authors to be computer
artists. Semantic adjectives frequently hide certain defectiveness or, at
least, ambiguity of definition: for example, there exists not pure mathematics,
but «Applied mathematics". The term the computer artist is rather
ambivalent. On the one hand, the adjective «computer» presents a kind of
apology to a potential spectator for the picture aesthetics (see the bridge
«picture»). And on the other hand, this adjective notifies a spectator of
particular tools and methods (avant-garde pretentious novelties) applied at the
creation of the picture.
The real
artist should be prepared to operate with anything and on anything. The
pictures of Anatoly Zverev (the artist of a tragic destiny, that, alas,
frequently strikes genius people; exhibition of his works took place in Moscow
not long ago), that were drawn almost with a cigarette stub on paper scraps,
and are now sold by auction at fantastic sums. Will printer listings ever be
exhibited at the Louvre or at the Hermitage or, at the very least, auctioned
off? Not Likely, because they can be sold on a diskette that was owned by the
computer artist (but it is a fetish – guitars of grand musicians are now sold
like that). In addition, computer art does not distinguish the original from a
copy. This fact alone may kill potential masterpieces[8],
which are sometimes published on magazine covers or inside glossy editions.
Pushkin had been speaking: «That is vulgar – what is popular». Only the most
ingenious artworks withstand the trial of being brought to the broad masses.
And it is precisely these masterpieces that are of fundamental importance to
the cultural stratum of present-day civilization.
The best way
to characterize any phenomena, especially writing an art criticism article, –
is to cite the classic quotation. Here it is:
I firstly
liked them for specific features
For eyes of
blue, for their noble paleness,
For modesty
– especially for being freshly charming;
But, God be
praised, I’ve found out soon –
It was a sin
to know them a little better –
They’re
lifeless as if being waxen figures;
But ours
ones!…
Guess what
Pushkin’s Don Juan was speaking of! Quite so – he was also speaking of computer
animation, of pictures created by means of computer graphics… Let's put it
mildly (with a certain hope) – he was speaking about modern samples of the
science, process engineering and art symbiosis. You see, computer pictures
allow you to feel more an imperfect tool (fresh charm – is the paradox of high
technologies), than the artist himself.
Thank you
for reading!