Mathcad:
From Graph
to Formula;
From
Computer Calculation to Internet-on-Line Analysis
V. Ochkov
http://twt.mpei.ac.ru/ochkov/v_ochkov.htm
Translated into
Summary of this Paper: Here, a particular
engineering task-automated treatment of the curved line group is addressed, and
then used to consider a new trend – the shifting calculations from the PC
workstation to the Internet Server.
First: Small but useful
things
Very often in engineering publications functional
relations are given not through formulas but rather though multi-curve graphs:
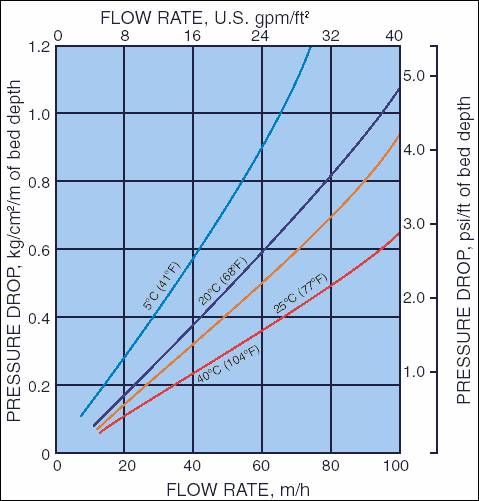
Picture No. 1:
Picture No.1 presents a graph which shows the unit hydraulic
resistance (pressure drop) imposed on flowing water as a function of the water
flow rate and water temperature. The figure reveals that the hydraulic
resistance increases with an increase in flow rate, and decreases with an
increase in temperature. This and similar graphs are often given for the
description of different processes as well as for their quantitative evaluation,
i.e. for calculations. This picture is used with a permission of a prominent
company specializing in water treatment equipment and has been extracted from
the company’s technical documentation.
In the above
mentioned company’s technical documentation, a «trace along the curve graph»
method is suggested for the determination of the hydraulic resistance. This simple
procedure can be described as follows: plot the magnitude of the flow rate along
the x-axis (using some scale), plot the isotherm curve (interpolating, if
necessary, from the existing ones) and find the answer along the y-axis.
Different
reference sources quite often employ a variety of nomogram charts, which have
to be dealt with in a specific manner like this one: The first argument (input
variable) goes onto the left scale, and the second argument
to the right. The two argument points are connected and the answer found where
the connection line intersects the intermediate scale (see one
example on the «live» nomogram on MAS). Generations of engineers have used such
nomograms with feelings of gratitude for their convenience,
but with the loss of accuracy and too the physical side - the essence of the
problem.
Even some simple
and cute mechanical devices (similar to the slide rule) have been manufactured (with
the built-in methodology of calculation hidden from view and the answers
obtained from pull/push hand movements). At one time, these gadgets were
especially popular among air/sea navigators.
It’s interesting though
that, even now, some newstands in the downtowns of
big cities sell two-disc devices which ask for your weight and height and then give
you an idea if your weight is acceptable (presumably, not too heavy).
With all the
romanticism and nostalgia of these cute devices and century-old graphs, modern
times require that these graphs, nomograms and
devices be replaced with accurate, up-to-date formulas and calculations. But,
unfortunately, this is not generally the case and here, according to our
understanding, are the reasons why:
·
Firstly, a noble desire to free the user from dull and
tedious calculations keeps the author from writing the equation for a
calculation. This is especially true, when the objective is not a precise
calculation, but just a quick, rough approximation.
Consider the water
treatment company, mentioned at the beginning of this writing. We give, as an
example of such rough approximation, their methodology for specifying a pump
for a filter (its pressure is mathematically a product of the unit hydraulic
resistance by the layer height). The company documentation recommends an
arbitrary increase of the design hydraulic resistance by an amount of 10 to 20%
(the so called safety factor to compensate for, on top of different
miscellaneous mishaps, the inaccuracies of getting the numbers by the «tracing
along the curve» method.
·
Secondly, quite often the mathematical relation between variables
does not exist in equation (or perhaps any other) form,
or what has been given in the charts is only a graphic interpretation of
empirical results, possibly with the help of asymptotic curves.
The curves shown at
the picture No1 were derived after filtering the
material using a special test stand with a special control over the flow rate,
and then measuring the water temperature and pressure drops.
Scientific
books (not engineering reference sources) generally recommend that graphical
presentations display the experimental points at intervals suitably spaced for interpolation.
The latest trend includes the links from the scientific research articles to
on-line web sites, where the original experimental documentation is saved. Readers
then have the means not just to verify the author’s conclusions, but also to develop
his/her own interpretation of the results. It is now even possible to advance
and refer to a program, containing a calculation, corresponding to the graph
curve.
The above
paper (the company documentation) is a good illustration of the qualitative side
(the nature) of the process. The site supporting this documentation offers
three paths for further analysis:
·
Get in touch with the author and
ask him/her for the equation (if such exists)
·
Derive the analytical details
yourself ( considering the nature of the problem)
·
Using available graphs for
different (but similar) conditions, derive the results
for the conditions of interest using the spline
interpolation.
The Mathcad application package offers built-in functions (lspline, pspline, cspline and bspline) for the spline-interpolation of a tabulated function of one or two variables. But dealing with functions of two variables is a bit difficult: these functions require that the initial tabular data be square (i.e. where number of points of the first variable is equal to the number of points of the second variable). More generally, the tabular data tends to be rectangular. Unfortunately, “squaring” the data through truncation reduces accuracy.
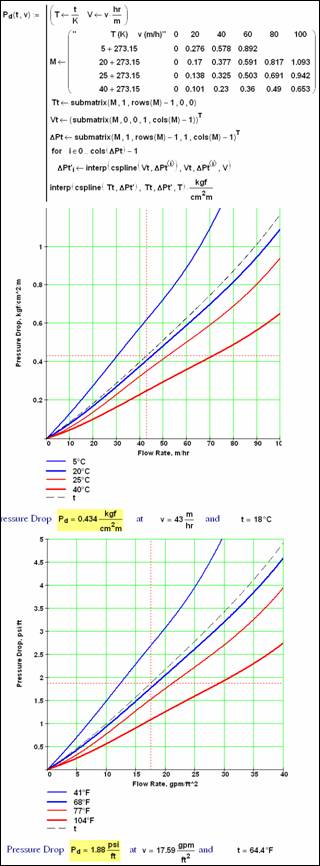
Picture No. 2.
Multi-purpose Mathcad-sheet to work with family of curves
The picture No.2 has been
included as a multi-purpose Mathcad sheet. It is intended to serve as a kind of
template for working with the family of curves. More specifically,
·
The magnitudes of the pressure
drops for any specific filter can be derived by scaling from the available
curves or obtained in any reasonable way (from the author of the original test,
for example). (They are shown graphically with the help of curves specifically
for several temperatures as functions of these temperatures and the flow rates
shown along the horizontal axis of the graph and analytically in a matrix form
with the temperature values specified at a row header and flow rates
magnitudes- in a column header.)
·
The input values can be presented
by dimensioned quantities (unlike the case of a general Mathcad matrix
operation) because they will be turned into dimensionless ones at the beginning
of the procedure. The size of the input matrix can be changed to accomodate all available information.
·
The desired pressure drop has been
programmed as a user’s function named DPd (math symbol to be used here).
·
The graph will show the «original»
curves and the desired curve for the temperature specified as an input value.
·
The spline-interpolation
information is given at the picture; it includes the parameters required.
·
The solution can be obtained in a
variety of units as well as symbolic form.
An Important Trend
With «dead» graphs, the link to the calculation program is broken. But Internet technology can be used to transform these graphs into formulas. This process is illustrated on www.vpu.ru and one of them can be use on-line – WebCalculations. [Visit the site http://mas.mathsoft.com/mas/library/calc_DeltaP_A400.mcd. Also see, Operation of Mathcad Application Server site www.mathcad.com/server.]
Conclusions
The Mathcad Application
Server (MAS) offers new and improved possibilities for the desimination and presentation of graphical (product) data . The advantages are clear:
· Users don’t need to acquire Mathcad itself (it can be expensive, illegal or both).
·
Data drivers can be easily
updated and/or corrected on the MAS Server.
Data files distributed for exercising Mathcad
worksheets are not easily managed and often become obsolete.
·
Mathcad is a mature application software
product which has been used over the years to solve numerous kinds of problems.
The corresponding Mathcad Worksheets
can be easily revised, updated and edited as required, and made available on
the MAS.