Price of an Old
Car
or
The way from Correlation to Regression in Mathcad
Translation
in English with the help of Nathan L. Hunsaker tkhunny@velocity.net
Definitions:
Correlation
is dependence without completely regular fluctuation. It is not possible to
take into account the influence of all change in all factors simultaneously.
Regression
is dependence on central tendencies of one or more variables.
And now the heart of the problem.
By chance the author found in the Internet (http://collab.mathsoft.com/read?8889,34)
the following correlation data[1]
(see the table – Price of an Old Car, Depending on Its Age and Mileage[2]).
Also, regression analysis was requested.
|
Age |
MileAge |
Price |
Age |
MileAge |
Price |
Age |
MileAge |
Price |
|
11,5 |
88000 |
1195 |
13,5 |
120000 |
495 |
7,5 |
41000 |
3495 |
|
13,5 |
103000 |
750 |
11,5 |
101000 |
895 |
13,5 |
124000 |
850 |
|
10,5 |
82000 |
1295 |
3,5 |
39000 |
4995 |
10,5 |
77000 |
1595 |
|
10,5 |
65000 |
1495 |
10,5 |
78000 |
1295 |
6,5 |
56000 |
3495 |
|
12,5 |
97000 |
800 |
6,5 |
52000 |
2695 |
12,5 |
83000 |
895 |
|
10,5 |
70000 |
1495 |
9,5 |
84000 |
1995 |
9,5 |
67000 |
2495 |
|
8,5 |
51000 |
2295 |
4,5 |
39000 |
3995 |
4,5 |
38000 |
3990 |
|
10,5 |
80000 |
1495 |
4,5 |
46000 |
3675 |
6,5 |
43000 |
3400 |
|
9,5 |
79000 |
1995 |
12,5 |
92000 |
795 |
13,5 |
92000 |
795 |
|
6,5 |
57000 |
2695 |
11,5 |
108000 |
975 |
11,5 |
78000 |
1295 |
More specifically, the request was to give a formula or graph that could
be used for an appraisal of the price of an old car by the year of manufacture
and the odometer reading (mileage).
This author saw the question as an excellent example of problems that
can be solved using MathCad. [3].
As a rule, one should begin regressive analysis (search for regression)
with visualization of the tabular data – see fig. 1,
fig. 2, fig. 3
and fig. 4, where the parameters of
cars are shown in volume (fig. 1). Three
different views are given (fig. 2, fig. 3 and fig. 4).
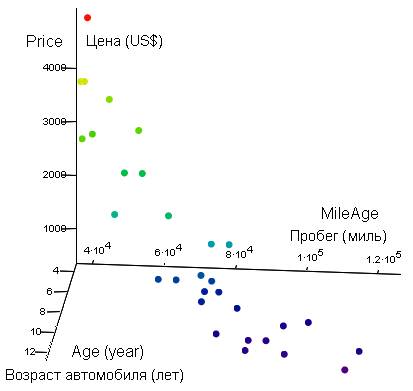
Fig. 1. Three-dimensional display of the correlation of the price of a
car and its known parameters – age and mileage
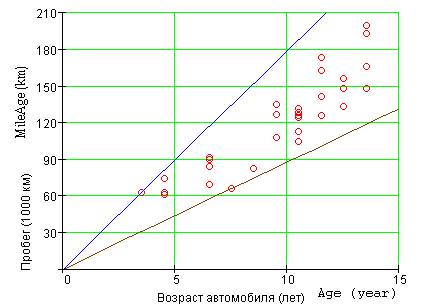
Fig. 2. Correlation of age and
mileage
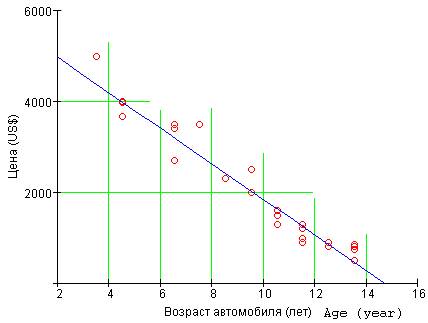
Fig. 3. Correlation of Price and Age
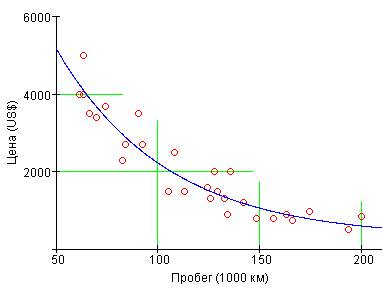
Fig. 4. Correlation of Price and
Mileage
Lines that describe following laws are lined in fig. 2, fig. 3 and fig. 4.
1. Correlation of the mileage of a car and its age is limited by two
considerations: ma
3. The dependence of the car's price on its mileage (fig. 4)
is more difficult – it appears to change exponentially: (a + 10b x).
Under such dependence, (b<0) the car's price is assumed never to reach zero.
We cannot say the same thing about the dependence of price on age (fig. 3).
In year 14-15 the car becomes «invaluable» in either of two ways – the car's
price is zero (most practical outcome) or the car becomes... a museum exhibit.
(Who understands collectors, anyway?)
Conversion from a Plane (fig. 2,
fig. 3 and fig. 4)
to a volume (fig. 1)
gives the following regression formula[3].
With this formula, we calculate the minimum price of the car (% of the price of
a new car[4]):
44.98+2.98▪Age+55.02▪10-0.00000937▪Mileage
where: Age is shown in years, but Mileage is shown in kilometers.
On a three-dimensional graph, our formula gives the following surface (fig. 5):
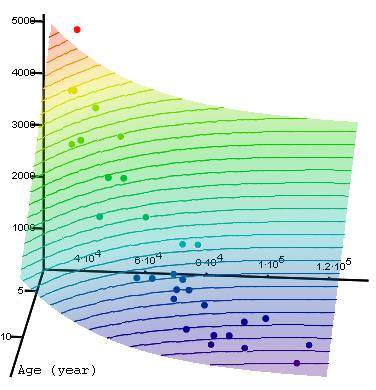
Fig. 5. 3D Plot of Correlation and Regression
of the Car's Price from its known Parameters – Age and Mileage
The points from our table are situated close to surface. It is easier to
see these points, in relation to the surface, if we turn the surface view sideways
(fig. 6):
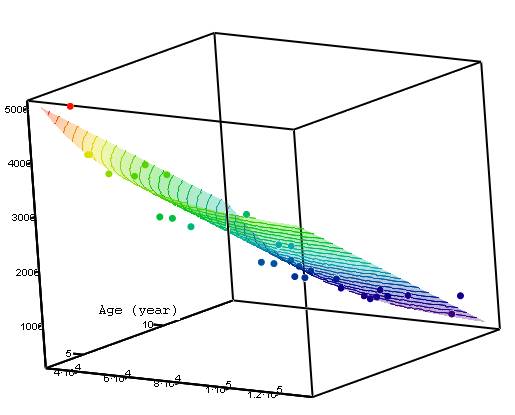
Fig. 6. «Correlation» of the Points
around «Regression»
From this view we can see (fig. 6)
that some of the points are above the surface and some are under the surface.
This is the direct result of the least squares criterion: the sum of squares of
deviations from the surface. The same criterion was used for determining lines
near points fig. 3
and fig. 4.
In the fig. 5
and fig. 6
the surface in all its «artistry» (it is semi-transparent – all points are
visible. The colors change from the cold tones (cheaper cars) to warmer tones
(more expensive cars) and «one-cost» lines are shown). It is not very
practical: To fix the price of the car we must use either the formula (see above), or the graph plot (fig. 7):
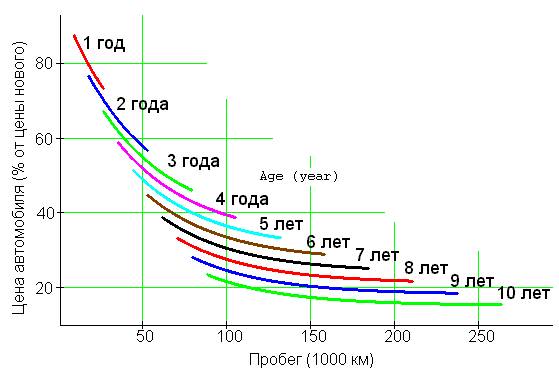
Fig.
7. Graph of The Decreasing Price of a Car
By the graph in fig. 7
it is possible to determine both the price of a car and to discard cars outside
acceptable limits, as shown in fig.2.
Mathcad-document performing the required calculations: (Car_Price.mcd –
Mathcad 2001 Premium). See: ftp://twt.mpei.ac.ru/ochkov/Auto.
Epilogue
To quote Winston Churchill "There are lies, _______ lies,
and Statistics" – the last being the hero of this article.
The task about the Price of the Old Car on the MAS: http://twt.mpei.ac.ru/MCS/Worksheets/old-car.xmcd
References:
1. Ochkov
V.F., Pushnachev U.V. «24
etudes on Basic».
2. Ochkov V.F., Rakhaev M.A.
«Etudes on QBasic,
QuickBasic and Basic Compiler».
3. Ochkov
V.F.. «Mathcad
8 Pro for students and engineers». ![]()